- Tall stack source - Ferrybridge power station
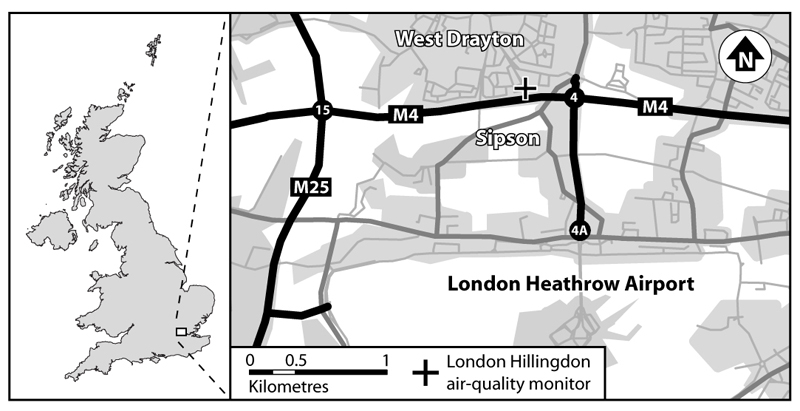
- Road source - M4 motorway, London Hillingdon
- Scunthorpe Steelworks
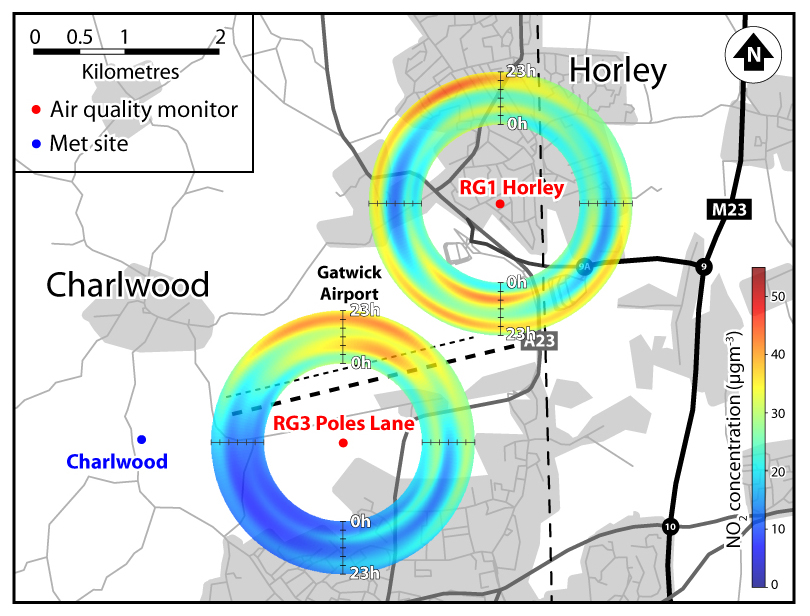
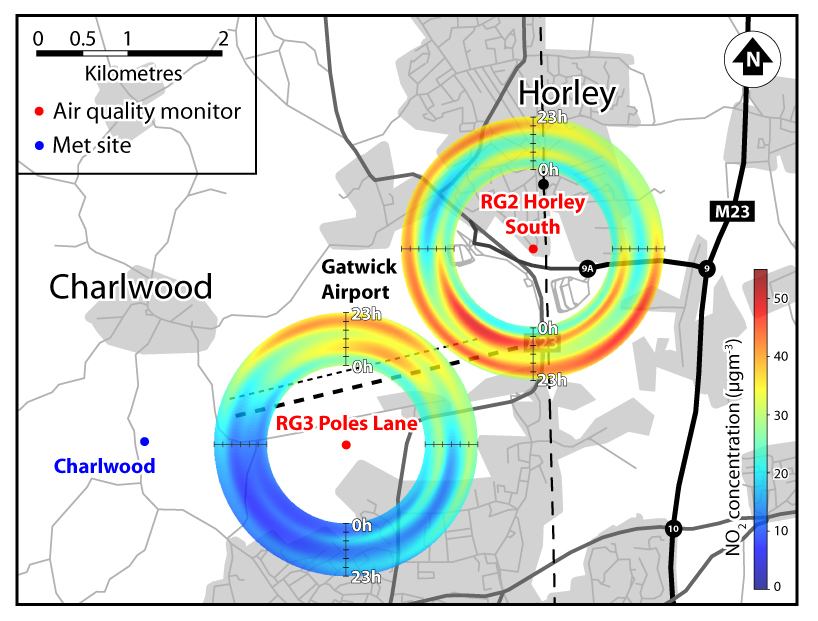
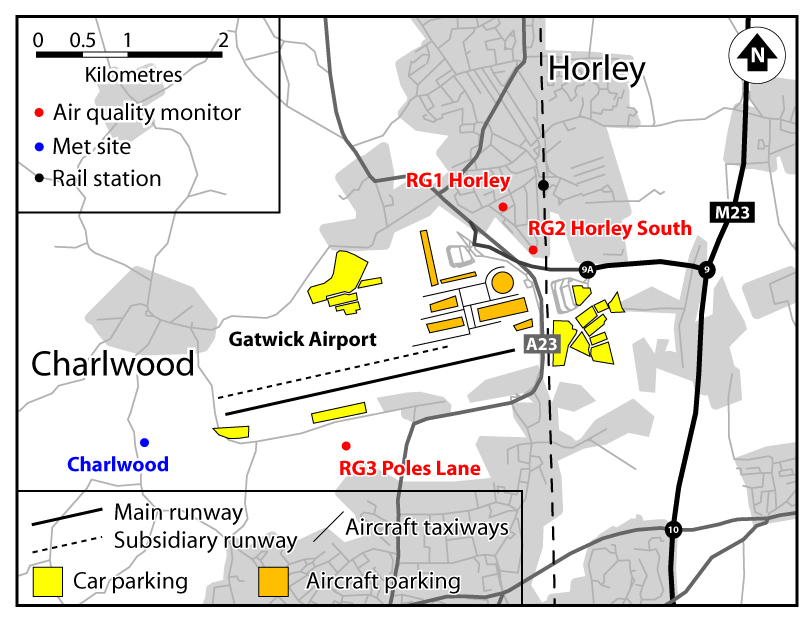
- Gatwick Airport
- Other case studies
Ferrybridge power station
This case study combines a number of AirTrack techniques that are described on our homepage
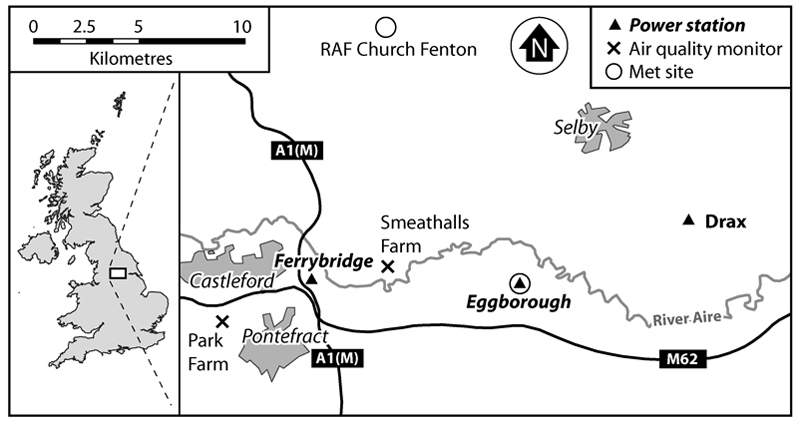
This case study focuses on Ferrybridge - a large coal-fired power station in the Aire Valley of Yorkshire (UK) and an SO2 monitor located about 4km down-prevailing wind (ENE) of the power station at Smeathalls Farm.
We examine if ambient air-quality monitoring at Smeathalls Farm can be used to track the emission performance of the power station. In particular, we examine conditionally-selected subsets of the data for evidence of strategic fuel-sulphur management over a 5-year period, between 2001 and 2005.
The map below shows the locations of 3 Aire Valley power stations, including Ferrybridge, and the locations of ambient air-quality monitoring stations at Park Farm and Smeathalls Farm. Meteorology is recorded at Eggborough power station, but not for the full duration of the air-quality monitoring campaign. Meteorological data were therefore taken from RAF Church Fenton.
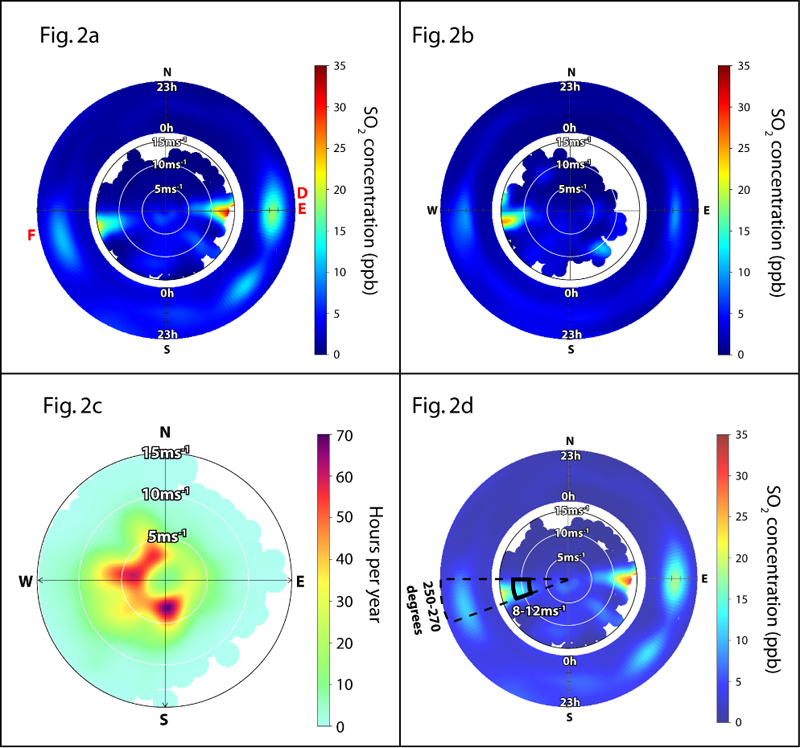
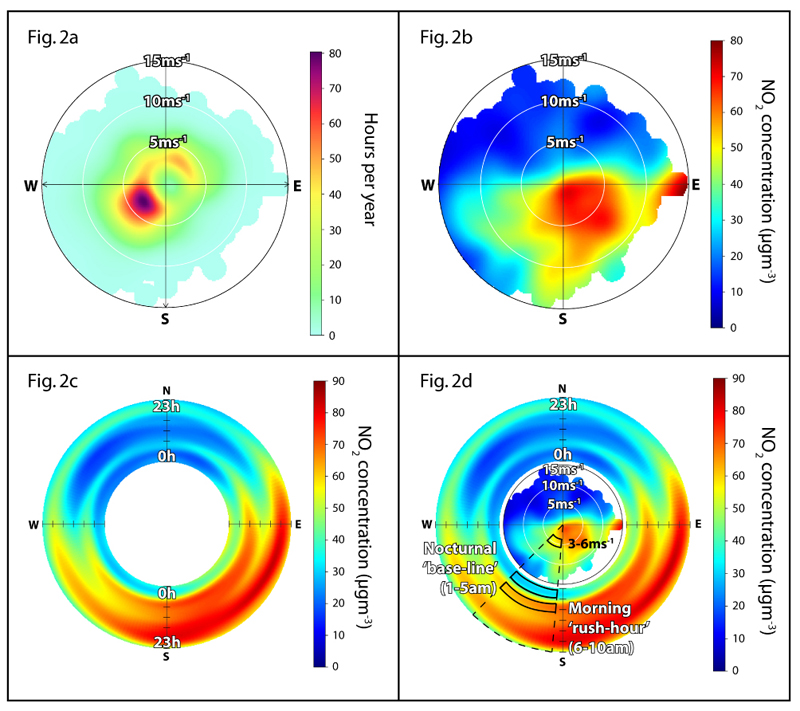
An initial assessment of the monitoring data is made by plotting the data in bi-polar plots
Fig. 2a shows monitoring data for 2001, and Fig. 2b shows corresponding data for 2005. The concentration 'hot-spots' in 2005 are less pronounced than those in 2001, which is consistent with a decline in SO2 emissions over the period.
Bi-polar plots of SO2 concentration (Figs. 2a & 2b) and wind-frequency (Fig. 2c) have been used to select hourly concentrations when the signal of Ferrybridge is strongest relative to other effects. Fig. 2d shows the meteorological 'window' that was defined to select concentration data that contains a strong and frequent signal of SO2 from Ferrybridge. The window is defined by bearings +/- 10-degrees from the direction of Ferrybridge (250-270 degrees) and by speeds between 8 and 12m/s.
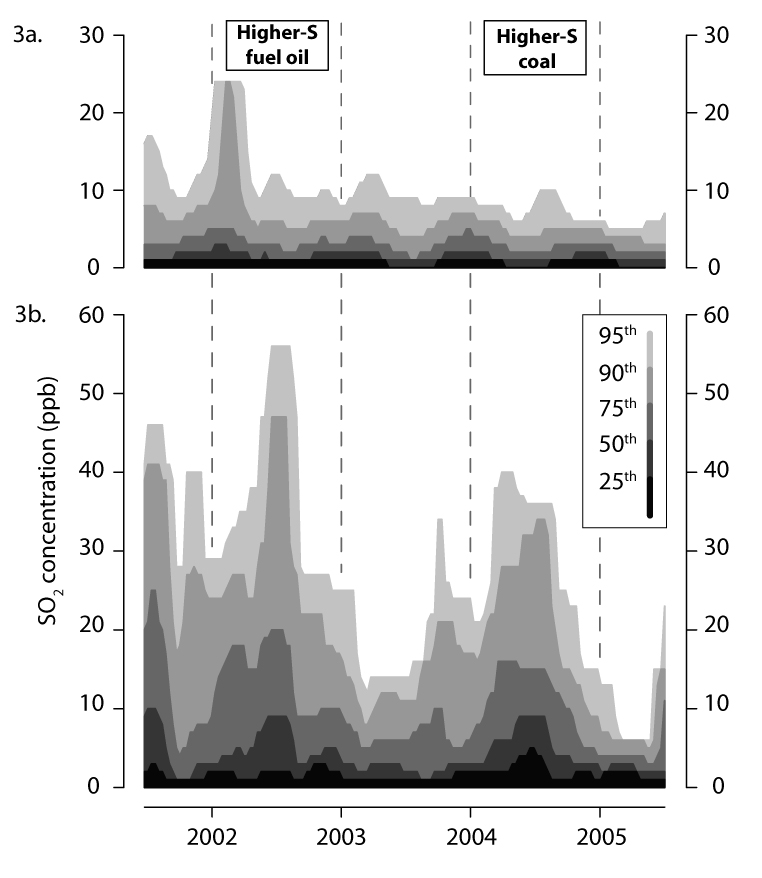
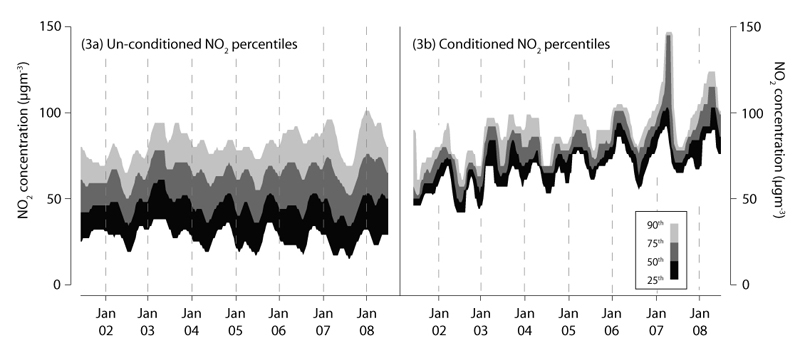
Fig. 3 compared trends in SO2 percentiles for un-conditioned (Fig. 3a) and conditioned (Fig. 3) data. Un-conditioned data contain all hourly measurements regardless of wind speed and direction, where as the conditioned data have been selected using the ranges of wind speed and direction shown in Fig. 2d.
Percentiles concentrations from un-conditioned data (Fig. 3a) indicate a general improvement in ambient air-quality at Smeathalls Farm, however, they do not distingish the performance of Ferrybridge from other power stations in the Aire Valley.
Percentile concentrations from conditioned data (Fig. 3b)reveal a specific and detailed picture of fuel-sulphur management at Ferrybridge. These interventions appear as synchronised changes that propogate through all percentiles. In particular, two notable upward excursions correspond to periods when stocks of higher-sulphur fuel were being used up.
The results of this case study have been prepared for submission to a peer-reviewed journal - we shall post updates on this here.
If you have any thoughts or comments on this case study, or about any aspect of the AirTrack project, we would like to hear from you
Click here to access our feedback form.
M4 traffic, London Hillingdon
This case study combines a number of AirTrack techniques that are described on our homepage
The results of this case study have been prepared for submission to a peer-reviewed journal - we shall post updates on this here.
If you have any thoughts or comments on this case study, or about any aspect of the AirTrack project, we would like to hear from you!
Click here to access our feedback form.
Scunthorpe Iron and Steel works
If you have any thoughts or comments on this case study, or about any aspect of the AirTrack project, we would like to hear from you!This case study combines a number of AirTrack techniques that are described on our homepage
Coming soon
Click here to access our feedback form.
Gatwick airport
If you have any thoughts or comments on this case study, or about any aspect of the AirTrack project, we would like to hear from you!This case study combines a number of AirTrack techniques that are described on our homepage
More details coming soon
Click here to access our feedback form.
Other case studies

